Those crazy polls are lying to us! At least that's what many pundits would have you believe. The polls tell that at the national level, the race is statistically tied (RCP Obama+0.1, Pollster Romney +0.1, TPM Obama +1.4. Yet state polls suggest a slight but persistent Obama lead. Serious election forecasters all predict an Obama win, although with slightly different levels of uncertainty. But for many pundits, their gut tells them something else. For many of them, Obama is such a terrible president they just cannot fathom the idea that not only is Romney not projected to beat Obama in a landslide, he isn't even projected to win at all! Yet they feel as though Romney has had some kind of momentum coming out of the Denver debate, meaning he should be poised to win. To them, there must be something wrong with both the forecasters and the polls. However, in the last few days HuffPost pollster has done an exceptional job busting a few of the more common myths coming from these pundits:
Myth: Polls are oversampling Democrats, making it look as though Obama is doing better than he really is.
I touched a bit on this claim back in September when it seemed as if pollsters and forecasters left it largely untouched. Since then, we have seen a few tackle this issue. However, it seems to persist even today, along with the observation that those polls which are "oversampling" Democrats also show Romney winning the Independent vote, often by large margins. Nowadays the focus on Ohio, which is no surprise given that it is the state most likely to decide the election. Now it is true there are polls giving Democrats up to an 8 point lead in Ohio. And it is true many of those same polls also show Romney winning the independent vote by large margins. And it is likely going to be the case that exit polls won't show Democrats with an 8 point lead among party identity either. In my last post, I pointed this out, but did not speculate as to why this is the case, and why we should still expect Obama to win by the same margins the polls predict. However, I suspected Romney's popularity among Independents was actually related, suggesting that Romney supporters were more often identifying as Independents than Obama supporters, boosting Romney's support among Independents as well as the Democrat party identification advantage. Today, Pollster blogger Nick Gourevitch confirmed this suspicion:...in recent Ohio polling, Romney's lead with Independents is inversely correlated with Democratic party identification advantage.
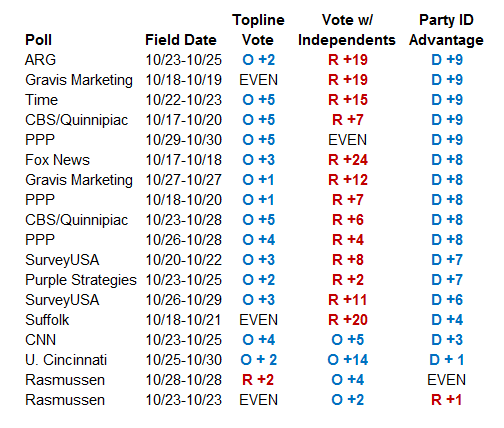
What does this mean? It means that polls with larger Democratic party identification advantages are showing bigger leads for Romney with Independents. And vice versa. The following chart is a slight adjustment of a chart posted by @numbersmuncher last week showing party identification spreads vs. the vote among Independents in recent Ohio polls where this data is published. The chart below is sorted by Democratic party identification advantage -- so the polls with the greatest Democratic margins are up top and the polls with the lowest margins are at the bottom:This shouldn't be too hard to understand. The first thing you should note is that there doesn't seem to be practically any correlation between Obama's lead and party ID advantages (with the exception of one Rasmussen Poll, which can be better explained by other factors). This suggests that the proportion of Romney and Obama supporters remains approximately the same throughout each poll, despite party ID advantages. Some polls such as CNN, U of Cincinnati, and Rasmussen are more likely to show Romney supporters identifying as Republicans and/or Obama supporters identifying as Independents than ARG, Time, or CBS/Quinnipac, which show approximately the opposite. As a result, the apparent Democratic ID advantage, as well as the Romney advantage among Independents, can best be explained by how a poll determines party identification. Remember that there is a substantial difference between party registration and party identification. It may also be interesting to note that the Republican-leaning Rasmussen poll gives Obama some of his best numbers with Independents.Yet why do these polls show such different results for party ID? Nick Gourevitch explains:
A quick glance at the chart above clearly shows this inverse correlation. Romney's biggest leads with Independents (except the one Suffolk poll) all come in polls where the Democratic party identification is largest. And the math backs up what the eye sees -- the correlation coefficient between the Independent vote and the party identification advantage is -0.61. While the correlation is by no means perfect (there are many other variables that impact these numbers), the trend clearly exists. (emphasis mine)
This can happen for a number of reasons. Pollsters use different questions and methodologies. Live interview polls and automated polls produce different party identification distributions (ones that are also different from in-person Election Day exit polls). Pollsters ask party identification in different ways. Some use three-point scales, others five-point scales and others seven-point scales. Some push "leaners" and some don't. Question ordering also matters - especially for pollsters who put party identification at the end of their survey. If you have a survey with a bunch of questions on social issues, it might cause more people to identify as Democrats in a socially liberal state, but might cause more people to identify as Republicans in a more socially conservative state.However, why is it that most of these polls show Democrat party identification so much higher than Republican party identification? Pollster Thomas M. Holbrook finds something that should give us a clue:
"One way of assessing the relative value of party for each of the candidates is by looking at rates of party affiliation in the electorate... These data show that the Democrats have held an affiliation advantage throughout the 2012 campaign, one that has ebbed and flowed a little bit and now stands at approximately six percentage points.
...
throughout this campaign period the Democratic Party has been viewed more positively than the Republican Party. In fact, there is not a single poll in this series in which the Republican party registered a net positive rating, and not a single case in which the net Republican rating was higher than the net Democrat rating. The average net rating for the Republican Party in this series is -13, whereas the average for the Democratic Party is +.3." (emphasis mine)This could explain why Romney supporters are more likely to identify as Independents this election. No doubt many of these self-described Independents identified as Republicans back during the 2010 elections. Yet throughout 2011, Republican party favorability dropped drastically, recovering some but not all in 2012. At the end of 2010, Republicans held a net favorability rating of -2.4. Today that number has fallen to -8.3. Democrats on the other hand, have seen very little change since the end of 2010. Democrats held a net favorability of ~1.4 points (can't see exactly). Today that number has slipped barely to -1.5, barely even statistically significant, and about half the drop seen by Republicans.
Update 11/5/12: I just found this article essentially confirming this suspicion. Actually most polls seem to indicate there are fewer voters identifying as Democrats now than in the 2008 exit polls, instead shifting to Independents. However, the drop is much larger with Republicans. This means that more Republicans than Democrats have shifted to thinking of themselves as Independents, causing Independents as a whole to be more conservative and Democrats to have a large identity advantage.
All of this should show how wrongheaded attempts to "unskew" polls really are. Unless independents are adjusted along with party ID, you actually end up oversampling Romney supporters!
Myth: Undecideds will break toward Romney because he is the challenger.
While it is true that Obama's lead nationally and in state's like Ohio aren't large enough to put Obama's numbers over 50%, the "Incumbent Rule," which states that undecideds generally break towards the challenger, may be less of a factor than some would have you believe. Pollster blogger Mark Blumenthal explains:
"When The New York Times' Nate Silver examined polls from 1998 to 2009, he found no evidence that "the majority of the undecided vote broke against the incumbents." His advice: "Focus on the margin between the candidates, just as you might instinctively do."In addition, he found little evidence this year will be an exception. This weekend, we will see the release of Pew's final survey report, which should shed more light on this question.
I will continue to update this posts as new information arrives...
No comments:
Post a Comment